
Serve Hold Rates and Break Points in Tennis Betting
 Available in US
Loading...

The single number a tennis model is built on
If you could know only one statistic before a tennis match, it shouldn’t be the head-to-head, the ranking or the recent form. It should be how often each player holds serve. Serve hold rate is the foundational brick of every serious tennis pricing model, the number from which the probability of games, sets and the whole match is mathematically constructed. Get a feel for hold rates and you’re reading the sport the way the people who set the prices do.
The reason hold rate sits at the centre is that tennis is, at its core, a serving contest. Win your service games reliably and you can only lose by being broken, which by definition happens on your opponent’s terms. The whole probabilistic structure of a match, who’s likely to win a set, how many games it’ll run, whether an upset is live, flows from the two players’ hold rates and how they interact. Everything else is detail layered on top of this single, powerful number.
What hold rate tells you
A hold rate is simply the percentage of service games a player wins, and its power lies in how much it compresses into one figure. A player who holds 90% of the time is a fundamentally different proposition from one who holds 75%, and that gap shapes every market on the board. The surface dependence is enormous: first-serve effectiveness sits around 67.5% on hard courts versus roughly 62.4% on clay for the men, and that difference in serve potency feeds directly into how reliably players hold across surfaces.

What makes hold rate so useful is that it separates a player’s serving from their returning, two skills that don’t always travel together. A big server might hold at an elite rate while breaking rarely, making them a coin-flip in matches that come down to tiebreaks. A returner might hold modestly but break constantly, dominating opponents with weaker serves. Reading the two numbers separately, hold rate and break rate, tells you what kind of match you’re likely to watch and which markets it suits, long before you think about who wins.
One caution from the integrity side, because it intersects here. Serve and hold statistics that suddenly behave strangely, a reliable server inexplicably collapsing on serve in a low-profile match, are exactly the patterns integrity bodies scrutinise. As one regulator has warned, those who try to manipulate the sport are increasingly targeting lower-level competitions, and no sport is immune. I mention it not to make you paranoid but because hold-rate anomalies on obscure matches are worth a second thought before you stake, since the cleanest statistical signal can occasionally be a warning rather than an opportunity.

From hold to match probability
This is where hold rate becomes genuinely predictive, and where you start to think like a pricing model. If you know how often each player holds serve, you can build up, game by game, the probability of winning a set and then the match. The maths compounds: a player who holds at 85% against an opponent who holds at 78% has a calculable edge in every set, and across a best-of-three or best-of-five that edge translates into a match probability you can compare against the bookmaker’s price.
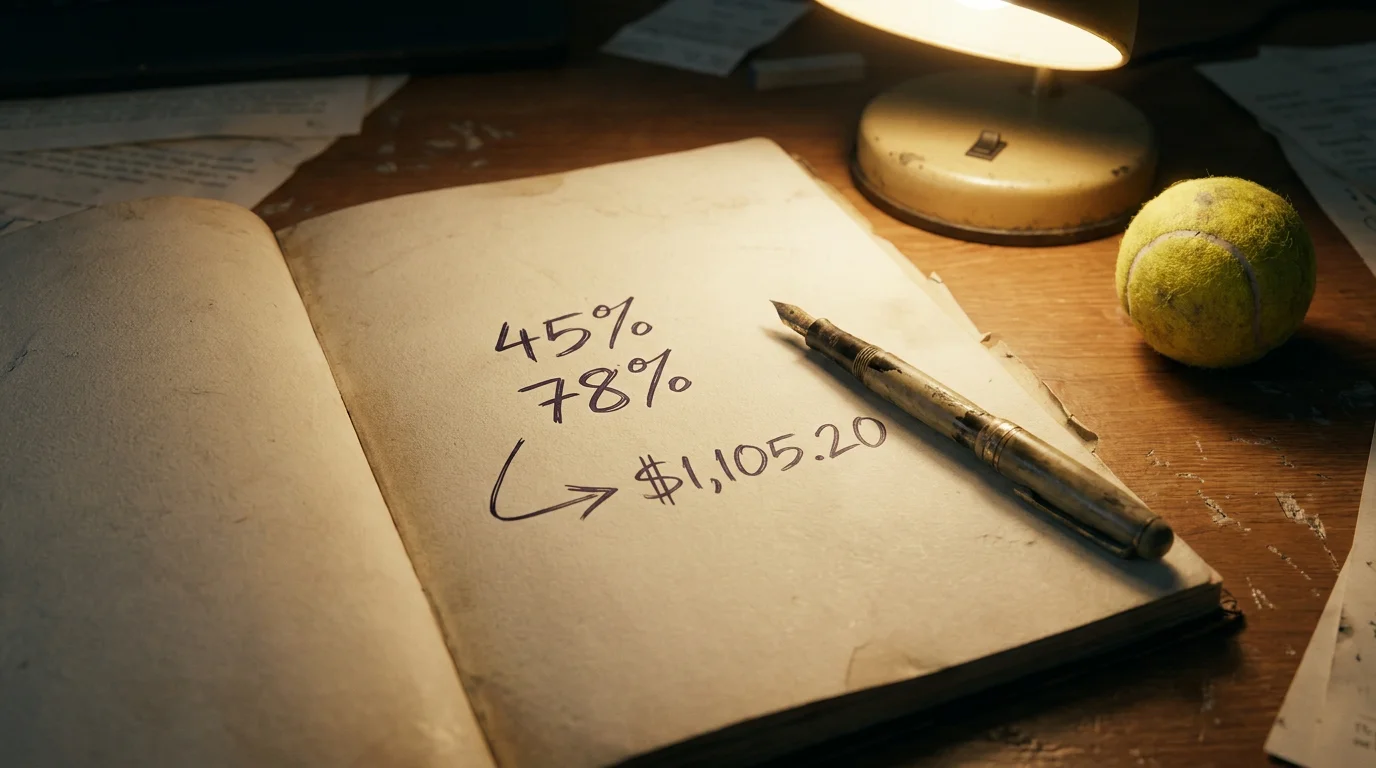
You don’t need to do the full calculation by hand to use the principle. The intuition is that small differences in hold rate produce large differences in match probability, because the advantage repeats across every service game. A five-percentage-point hold edge doesn’t mean a five-percent match edge; compounded over a match, it can mean a decisive favourite. At the fastest events, where servers held close to 87.8% of their service games, holds become so routine that matches hinge on a tiny number of break points, which magnifies the importance of every single one.
This is the bridge from raw statistics to actual value, and it’s the heart of pricing a match yourself. When your hold-rate-based estimate of a player’s match probability diverges from the implied probability in the bookmaker’s odds, you’ve found a potential edge, and that comparison is the entire engine of value betting, which my colleague lays out fully in the guide to finding value in tennis. Hold rate is the input; value is the output.
Break points and clutch
Break points are where matches are decided, and they’re also where punters most often fool themselves. The temptation is to treat break-point conversion as a stable skill, to say a player is “clutch” because they saved a string of break points last week. The data is far less kind to that story. Break-point conversion and saving are noisy, small-sample statistics that fluctuate wildly and regress hard toward a player’s underlying serve and return quality.

Think about how few break points actually occur in a match, often just a handful, and you’ll see the problem. A player who saves five of six break points in a match has produced an impressive-looking number from a sample far too small to mean anything reliable. Next match they might save one of six, not because their nerve failed but because that’s what small samples do. The underlying hold rate and return rate are the stable, predictive figures; break-point conversion is mostly the noise those figures generate in any given match.

So my working approach is to lean on hold and break rates as the bedrock and to treat break-point and clutch statistics with deep suspicion. A player isn’t a strong server because they saved break points; they save break points because they’re a strong server, and the hold rate already told you that more reliably. When the market overreacts to a flashy clutch narrative, pricing a player up because they “always come through under pressure,” that’s often where the value sits on the other side. Trust the foundational number, discount the dramatic one, and you’ll be reading serve statistics the way they’re meant to be read: as a stable base of probability, not a highlight reel of pressure moments.
Articles
Published by the AceEdge team.
